NFL Football Statistics: Teams Ranked by Wins Against Point Spread (ATS) from Best to Worst in Past Seasons
By Ion Saliu, ★ Founder of Sports Betting Mathematics


♥ First capture by the WayBack Machine (web.archive.org) on October 14, year of grace 2007.
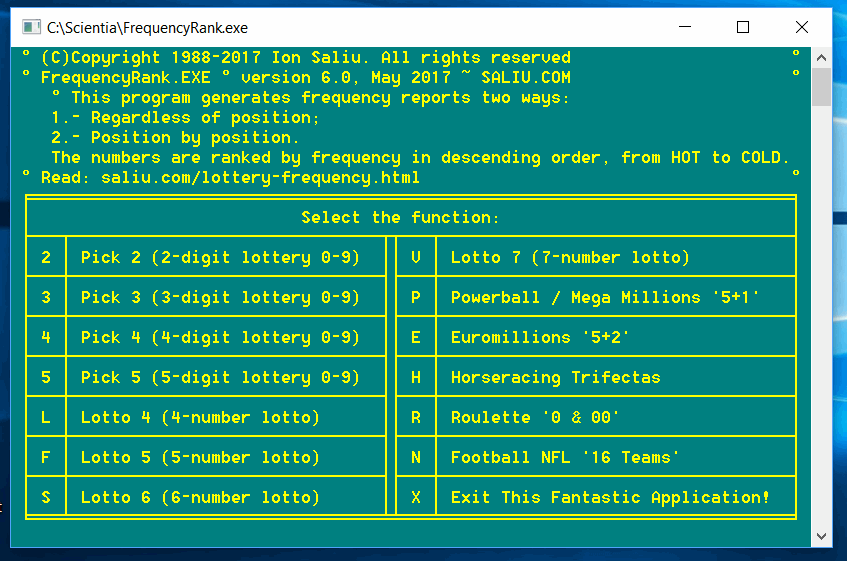
Reports created by FrequencyRank, sports betting statistical software.
The statistical reports rank the NFL teams by their frequency against the spread (ATS). The teams are listed in descending order, from the best to the worst teams. The reports show the number of hits ATS; i.e. amount of games in which that particular NFL team was a winner ATS or in compliance with the odds.
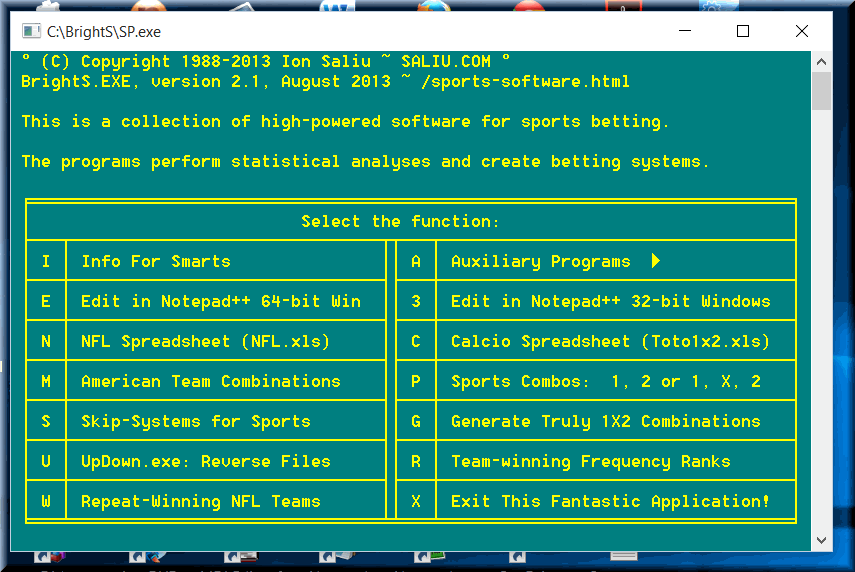
A statistical report as such is not of much use. The short-term ranges of analysis offer stronger tendencies, in accordance to the Fundamental Formula of Gambling (FFG). For far better results, run the special lottery software SkipSystem:

The reports that follow were created in January 2012 using a special edition of the software. It is different from the version listed above, included in the 2011 edition of BrightS, integrated sports betting software.
• Current NFL format: 32 teams playing from 13 to 16 games per week, 17 weeks a year (except for 1993 and 2001, each with 18 regular season games). The postseason is not included in this type of analysis. The results or data file (NFL.ODS in the current version of the program) must have exactly 15 winning teams per line. If a week has 16 games, the winning team of the NFL Monday Night Football game was discarded. When an NFL week has 14 (or fewer) games, the user must add the word OPEN to have 15 entries per line. Valid for the 2011 edition of BrightS.
The currently public NFL.ODS file has results from the 1992 season to Week 5 of the 2006 NFL regular season.
Moreover, I updated the data file to work with 16 games per week. The new file name is NFL-16.ODS. The new file consists of 16 football teams per line, or ATS results. I created also a special program to work with the new format. The results start at the beginning of the 1992 NFL season. The file ends with the 2011 regular season. The Monday Night Football games are accurately included for the period 2004-2011.
I included a special text file: NFL-ATS-16.ODS. It shows when an NFL regular season ends. It helps to point out the beginning and the ending of various reports. You should record the ATS results in this file; then, copy and paste to NFL-16.ODS. I updated also the auxiliary file holding the correct team names: TEAMS-16.NFL. The only difference is Buccaneers instead of Bucs in TEAMS.NFL.
The updated version of the statistical software is named NFLRank16. Select the renamed function F = NFL Football, 16 Teams.
The registered members are encouraged to download the files listed below. Look for that 16 in the file names to work with the new format. The complete updates should be finalized in time for the new (2012) NFL regular season. Left-click to download the EXE file(s). If you left-click the other file types, they'll open in your browser. If you right-click those files, select Save target as in the ensuing context menu. Make sure the files keep their original names.
The following statistical reports rank the NFL football teams by their wins against the point spread (ATS). The teams are listed in descending order, from the highest frequency (“hottest”) to the least winning teams (“coldest”). The reports show the number of hits: Number of wins against the spread (ATS). By and large, the ATS wins are close to number of straight wins.
The percentage parameter represents the frequency as the percentage of wins considering number of teams and number of games per week. Each football team has a so-called bye week per regular season. Therefore, each team plays only 16 games in a 17-week regular season. The winning percentages take into consideration the bye week.
The ATS is a statistical parameter that is indicative of the parity of the National Football League (NFL). In turn, parity assures fairness, which leads to a high level of competitiveness.
ATS implies that the teams should meet expectations. That is, the better teams are expected to win by a margin of victory or point spread. But the bookies select such a point spread that can go both ways. That would be the equalizer for the underdog. In other words, the chance is 50-50 from the bettors' perspective. One can bet either way with an equal chance to win — theoretically. In fact, the sport books rely on it!
The statistical reports do show equal chance as far as the ATS percentages are concerned. Virtually all teams should have 50% win-rates every year and also over any period of time (number of seasons). Reality shows that around half of the NFL teams go above the 50% win margin. Those are, in general, the good teams in that period of time. The other half of the NFL teams are below the 50% success level! They are considered bad teams in the respective range of analysis.
Shorter ranges of analysis (e.g. the 5-year period) show a more accented bias. The better teams tend to be successful over shorter periods of time. The longest statistical ranges (e.g. the 20-year period) diminishes the bias. The winning percentages of the successful NFL teams get closer to the 50% mark! The better teams in previous seasons get older and don't get the best draft picks. The parity rules!
There are differences in the history of the league. The number of professional football teams is variable. Some football teams have been around since the very beginning. A few teams are new. Yet, other teams disappeared, and then came back to life!
The 5-season statistical report has the highest degree of accuracy, followed by the 10-season range of analysis.
You will see in the reports pretty good rankings for a few teams who had… losing seasons! One fact of life in the NFL is pride. There teams who are considered “bad”. Such teams know they will have losing seasons. Yet, they fight to beat the point spread! The players believe they achieved something if they were not blown away by the better team!
                The NFL Teams Ranked by Wins Against The Spread (ATS)
                5-Year Report: 2011 - 2007
                Weeks Analyzed:  85
                Expected Wins:  50.00%

                Rank   Team          Hits    Percentage

                  1    PACKERS        50       62.50%
                  2    FALCONS        49       61.25%
                  3    PATRIOTS       47       58.75%
                  4    SAINTS         46       57.50%
                  5    GIANTS         44       55.00%
                  6    TITANS         44       55.00%
                  7    49ERS          43       53.75%
                  8    COLTS          43       53.75%
                  9    TEXANS         42       52.50%
                 10    PANTHERS       42       52.50%
                 11    BROWNS         41       51.25%
                 12    RAVENS         41       51.25%
                 13    LIONS          41       51.25%
                 14    STEELERS       41       51.25%
                 15    EAGLES         41       51.25%
                 16    CARDINALS      41       51.25%
                 17    CHARGERS       40       50.00%
                 18    BILLS          40       50.00%
                 19    DOLPHINS       39       48.75%
                 20    REDSKINS       38       47.50%
                 21    JETS           38       47.50%
                 22    SEAHAWKS       38       47.50%
                 23    RAIDERS        37       46.25%
                 24    BENGALS        37       46.25%
                 25    CHIEFS         37       46.25%
                 26    BEARS          37       46.25%
                 27    JAGUARS        35       43.75%
                 28    COWBOYS        35       43.75%
                 29    VIKINGS        35       43.75%
                 30    BUCCANEERS     34       42.50%
                 31    BRONCOS        33       41.25%
                 32    RAMS           30       37.50%


                The NFL Teams Ranked by Wins Against The Spread (ATS)
                10-Year Report: 2011 - 2002
                Weeks Analyzed:  172
                Expected Wins:  50.00%

                Rank   Team          Hits    Percentage

                  1    PATRIOTS      100       61.73%
                  2    CHARGERS       91       56.17%
                  3    PACKERS        90       55.56%
                  4    RAVENS         89       54.94%
                  5    FALCONS        87       53.70%
                  6    COLTS          87       53.70%
                  7    SAINTS         87       53.70%
                  8    EAGLES         85       52.47%
                  9    CHIEFS         85       52.47%
                 10    GIANTS         84       51.85%
                 11    TITANS         83       51.23%
                 12    BILLS          82       50.62%
                 13    PANTHERS       82       50.62%
                 14    STEELERS       81       50.00%
                 15    BEARS          80       49.38%
                 16    REDSKINS       78       48.15%
                 17    BROWNS         78       48.15%
                 18    SEAHAWKS       78       48.15%
                 19    JAGUARS        78       48.15%
                 20    TEXANS         78       48.15%
                 21    COWBOYS        78       48.15%
                 22    LIONS          77       47.53%
                 23    JETS           76       46.91%
                 24    BENGALS        76       46.91%
                 25    DOLPHINS       76       46.91%
                 26    BRONCOS        76       46.91%
                 27    CARDINALS      75       46.30%
                 28    49ERS          75       46.30%
                 29    VIKINGS        73       45.06%
                 30    BUCCANEERS     70       43.21%
                 31    RAIDERS        64       39.51%
                 32    RAMS           64       39.51%


                The NFL Teams Ranked by Wins Against The Spread (ATS)
                20-Year Report: 2011 - 1992
                Weeks Analyzed:  341
                Expected Wins:  50.00%

                Rank   Team          Hits    Percentage

                  1    PATRIOTS      176       54.83%
                  2    PACKERS       172       53.58%
                  3    EAGLES        170       52.96%
                  4    CHARGERS      169       52.65%
                  5    STEELERS      168       52.34%
                  6    TITANS        168       52.34%
                  7    CHIEFS        167       52.02%
                  8    FALCONS       167       52.02%
                  9    GIANTS        165       51.40%
                 10    SAINTS        165       51.40%
                 11    BRONCOS       164       51.09%
                 12    BEARS         158       49.22%
                 13    COLTS         158       49.22%
                 14    BILLS         157       48.91%
                 15    49ERS         155       48.29%
                 16    COWBOYS       155       48.29%
                 17    JETS          154       47.98%
                 18    DOLPHINS      154       47.98%
                 19    LIONS         153       47.66%
                 20    SEAHAWKS      151       47.04%
                 21    BUCCANEERS    151       47.04%
                 22    BENGALS       151       47.04%
                 23    VIKINGS       151       47.04%
                 24    REDSKINS      148       46.11%
                 25    PANTHERS      147       45.79%
                 26    CARDINALS     147       45.79%
                 27    RAVENS        140       43.61%
                 28    JAGUARS       139       43.30%
                 29    RAMS          138       42.99%
                 30    RAIDERS       134       41.74%
                 31    BROWNS        129       40.19%
                 32    TEXANS         78       24.30%  = started in 2002


Home | Search | New Writings | Fundamental Formula | Odds, Generator | Contents | Forums | Sitemap
