Pick-4 Stats: Digits Ranked by Frequency from Best to Worst Numbers, Hot to Cold


Reports created by FrequencyRank, lottery, lotto, Pick-4 statistical software.
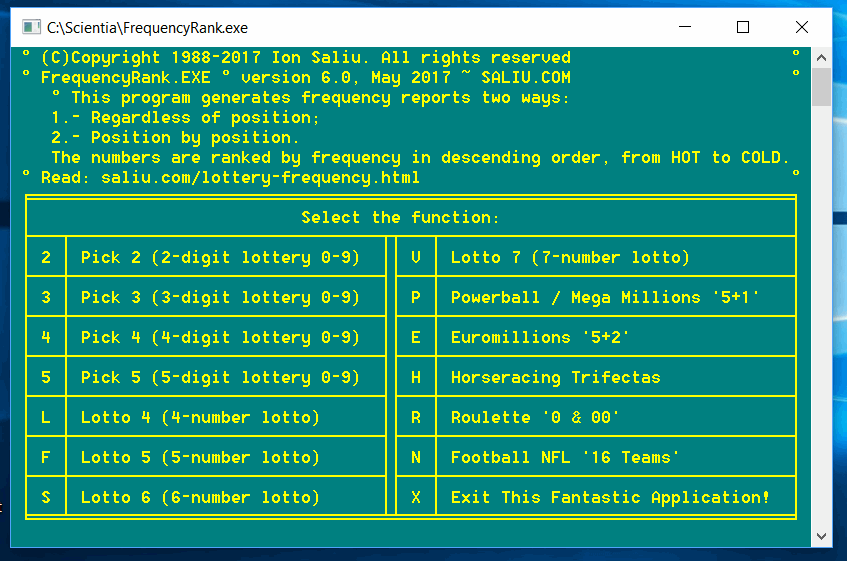
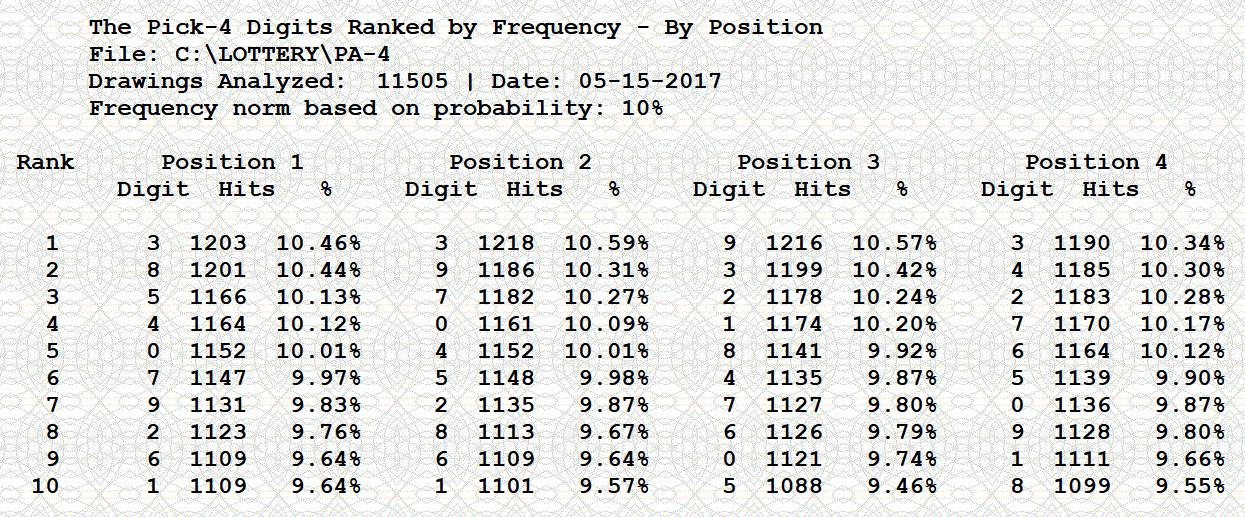
The statistical reports rank the Pick 4 digits by their frequency. The numbers are listed in descending order, from the most frequent (the hottest or the best) to the least frequent digits (the coldest or the worst numbers). The reports show the number of hits; i.e. amount of drawings in which that particular Pick-4 digit was a winner.
The ranking by frequency is performed two ways:
1) Regardless of position;
2) Position by position.
You will notice differences in the two reports.
~ Regardless of position: Counts in how many draws the digit came out;
~ Position-by-position: Counts all occurrences of a digit.
The position-by-position frequency will always show the exact amount of digits that appeared in a number of drawings analyzed. For example, the span of analysis was 100 drawings. If we add up the frequencies for digit position 1, the amount must be 100. The same is true for the other positions. If we add up the frequencies for the four positions, the total must be 100 x 4 = 400.

A statistical report as such is not of much use. The short-term ranges of analysis offer stronger tendencies, in accordance to the Fundamental Formula of Gambling (FFG). For far better results, run the special lottery software SkipSystem:
• Current Pick 4 game format: 4 digits from a field of 10, from 0 to 9
• Total drawings in this results file: 11505
• Most recent drawing in this file: May 15, 2017 (8 3 3 4)
• Data recorded in Pennsylvania Lottery, evening drawings only.
You will notice that the discrepancy in frequencies is determined by the length of analysis (parpaluck) — for the position-by-position analysis as well. The longer the parpaluck, the closer the frequency percentages get to one another.
One caveat: The Pennsylvania pick 4 game has a very long history. Admittedly, mistakes are likely. I entered data from a multitude of sources. Earlier, I entered data manually. I might have also missed or deleted some drawings. I might have deleted quadruple combinations, such as 0000, 1111, etc.
                The Pick-4 Digits Ranked by Frequency
                File: C:\LOTTERY\PA-4
                Drawings Analyzed:  11505 | Date: 05-15-2017
                Frequency norm based on probability:  34.39%

                Rank   Digit     Hits   Percentage

                  1      3      4090      35.55%
                  2      4      3999      34.76%
                  3      9      3998      34.75%
                  4      7      3962      34.44%
                  5      0      3944      34.28%
                  6      2      3938      34.23%
                  7      8      3916      34.04%
                  8      5      3895      33.85%
                  9      6      3889      33.80%
                 10      1      3844      33.41%

The short span of analysis is where the money is. The short parpalucks create staggering biases in pick-4 digit frequency. Any lottery strategy should focus only on short parpalucks.
Axiomatic one, see also freely:
Similar reports for other pick, or digit, or daily lottery games:


Home | Search | New Writings | Fundamental Formula | Odds, Generator | Contents | Forums | Sitemap
