Lotto Strategy - Lottery Number Pairing, Pairs, Frequency
By Ion Saliu, ★ Founder of Lotto Mathematics


Written on July 25, 2001; later updates.
• I have received some interesting feedback in response to Most powerful lottery strategy? Pairs, pairings, frequency, lotto Wonder-grid. I have rewarded the authors as promised. They received the pick-4 software. Unfortunately, LOTWON4 is not of much use to those who live in jurisdictions without pick 3/4 lottery games. A promise is a promise, so I added an option to the reward system. An author can now choose to receive a more potent SoftwareLotto6 - the collection of utilities for lotto-6 games.
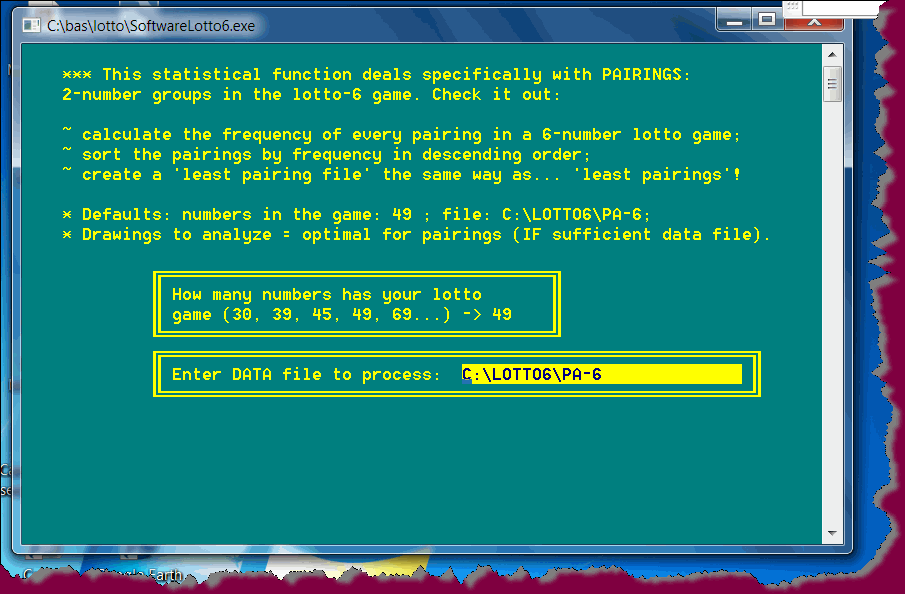
The newest version of my Super Utilities calculates the frequencies of all lotto pairings for every lotto number. It is a major component of Bright6 (2011), definitely the most powerful collection of lotto software applications. The following pairing report was done by function F = Frequency Reports by Lotto Number.

The most useful capability of the new UTIL-6 is related to what I called in a previous post the lottery "wonder-grid". I also call it the "magical wheel" - for there is no better method of "wheeling" lotto numbers. I briefly presented the lottery strategy in my post "Re: An experiment in mutual cooperation/A 'wonder' lotto strategy?" The idea is to play every lotto number plus its 'top five pairings'. If the lotto game has 49 numbers, we play 49 combinations. That is, a 49-ticket wheel. The UTIL-6 currently on my download site creates a file with the frequencies of all the pairs in a lotto game. The frequencies are sorted in descending order, i.e. from the most frequent pairing to the least frequent one. That version of the program, however, does not create a file that can be used directly as a lotto wheel (e.g. 49 lines of 6 numbers each). It is not too hard to create such a file manually, using copy-and-paste.
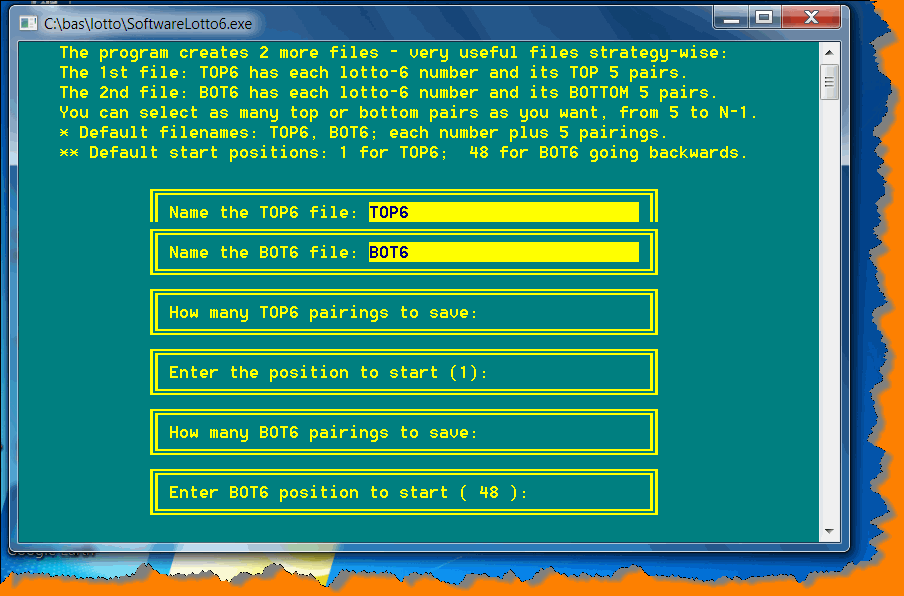
The new SoftwareLotto6 creates the lotto wheel automatically. Moreover, the program offers a lot more choices. It defaults now to an optimal range of analysis. The user has the option to select how many lottery 'worst pairings' to save to file. Or, how many 'best pairings' to write to disk, and also at what point to start. The user can choose, for example, to write to file the 'top 7 pairings' beginning with the 3rd best pair, instead of the very best (first) one.
I did a test. I generated a data file for a lotto 49/6 game. I ran SoftwareLotto6 and created a WHEEL-49 file consisting of each lotto number followed by its 'best 5' pairings. The file looks like this:

Lotto number 7 was best paired with #15 (6 times in 147 drawings), #22 (5 times), #41 (5 times), #6 (4 times), #20 (4 times). That amounts to 24 times out of 90 appearances of all pairings for number 7. Or, number 7 was paired with its 'top 5' in 27% of the cases! Meanwhile, number 7 was not paired at all (i.e. in 147 drawings) with 6 other lotto numbers! Here is the fragment of PAIRS6 (that shows the frequency of all pairs in a lotto game):
Number: 7 Hits: 18 ( 12.2 %)
Number: 8 Hits: 20 ( 13.6 %)
I ran then SoftwareLotto6 and selected the option 'W – check for Winners'. To my positive astonishment, the 49-line lotto WHEEL49 had 76 '4 of 6' winners (1 in 5) and 4 '5 of 6' winners (1 in 100) in 400 drawings analyzed! That's serious leverage if you consider that people are astonished by static lotto 49/6 wheels assuring '3 of 6' in 160+ lines! I don't even bother to check for '3 of 6' winners. I am sure, there is a ton of them, and I mean hundreds!
The winning report is at the end of this message. You can do it for yourself, with a real lotto drawing file. I am sure that real drawing files are even more biased than random combination files. You'll see serious bias in the report. The lines starting with lotto number 7 had 6 hits. Meanwhile, there was no hit for lotto number 12 and its 'top 5 pairings'.
How is it possible for a 49-line wheel to yield far better results than a 160-line static lottery wheel? The answer is in 'static'. A static wheel considers all number patterns to be probabilistically and statistically EQUAL all the time. That's the fundamental sin. FFG proves that the probability of appearance is determined by the AGE of the last appearance. For example, a lotto number is more likely to repeat (to be drawn again) after a skip equal to/less than its median. For a lotto 49/6 game: a lotto number will repeat after 6 misses in at least 50% of the cases. Look at the skip chart for number 6:
Number: 6 (22 hits)
In 14 of its 24 hits, the lotto number 6 waited 5 or fewer drawings between hits (58%). (A skip of 0 is another way of saying that the number came out in consecutive drawings.)
There are many other patterns that show the same discrepancy. You may want to look at a simpler lottery game, such as pick-3. Some lotto combinations come out 10 times in 1000 draws, while other combinations do not come out within the same range. The static sin considers that all combinations will come out with an equal frequency because they have the same probability 1/N. You will never ever see a random event (such a lottery game) showing equal frequencies among its elements. Now you understand why a 160-line lotto WHEEL49 is far less efficient than the dynamic WHEEL49 created by UTIL-6. The 160-line static lotto wheel combines number 7 with numbers like 44, 35, 29, 21, 42, 11. Those numbers came out ZERO times paired with number 7.
 1   15   46   47   18   19
 2   21   16   25   29   33
 3   23   29   31   42   48
 4   8   32   41   12   30
 5   9   10   29   30   31
 6   28   14   15   25   9
 7   15   22   41   6   20
 8   15   33   24   17   4
 9   26   6   33   48   15
10   33   25   15   42   1
...
With #: 15 22 41 6 20 10 12 30 32 33 36 2 14 23 24 25 26 4 17 18 19 37 38 9 43 48 49 1 16 34 5 3 13 39 40 27 28 45 46 47 8 31 44 35 29 21 42 11
Hits: 6 5 5 4 4 3 3 3 3 3 3 3 2 2 2 2 2 2 2 2 2 2 2 2 2 2 2 1 1 1 1 1 1 1 1 1 1 1 1 1 1 1 0 0 0 0 0 0
Pairs total: 90
With #: 15 33 24 17 4 19 22 12 26 13 39 45 46 49 21 11 3 25 1 27 30 31 32 6 38 16 41 9 10 20 34 36 37 28 29 5 42 43 44 14 7 47 48 23 35 2 40 18
Hits: 7 6 5 5 4 3 3 3 3 3 3 3 3 3 2 2 2 2 2 2 2 2 2 2 2 2 2 2 2 2 1 1 1 1 1 1 1 1 1 1 1 1 1 1 0 0 0 0
Pairs total: 100
* Skips: 30 2 0 4 0 6 19 0 2 0 0 3 2 5 7 11 1 2 6 4 8 6
* Sorted Skips: 0 0 0 0 0 1 2 2 2 2 3 4 4 5 6 6 6 7 8 11 19 30
* Median Skip: 3
                LOTTO-6 Winning Number Checking
                Files: MOST6 in Lotto DATA-6

  Line    Numbers                              6         5         4
  no.     Checked                           Winners   Winners   Winners

    1     1 15 46 47 18 19       in line #                         100
    1     1 15 46 47 18 19       in line #                         117
    2     2 21 16 25 29 33       in line #                         15
    4     4  8 32 41 12 30       in line #                         75
...
    7     7 15 22 41  6 20       in line #                         87
    7     7 15 22 41  6 20       in line #                         106
    7     7 15 22 41  6 20       in line #                         142
...
   46    46 29 13  1 41  2       in line #                         90
   46    46 29 13  1 41  2       in line #                         122
   47    47 43 11 15 20 34       in line #                         71
   48    48  9 37 41 14 19       in line #                         380


